When you view your account dashboard or your app dashboard, you are automatically shown a summary of your account or app usage respectively. This includes a high level summary of your usage, billing information where relevant, and some charts for key metrics such as messages, connections, channels and bandwidth.
If you require detailed stats to view or download for your account or apps, you can find this by following the link beneath your summary stats table, or beneath your charts. See screenshots below.
Ably stores statistics for the following time periods, however, they can only be queried via the Stats API:
|
Granularity |
Storage Period |
|---|---|
|
Minute |
5 days |
|
Hour |
90 days |
|
Day & Month |
Indefinitely (NB: Subject to future change) |
1. From within your app or account dashboard, follow the link beneath to view or download your detailed stats
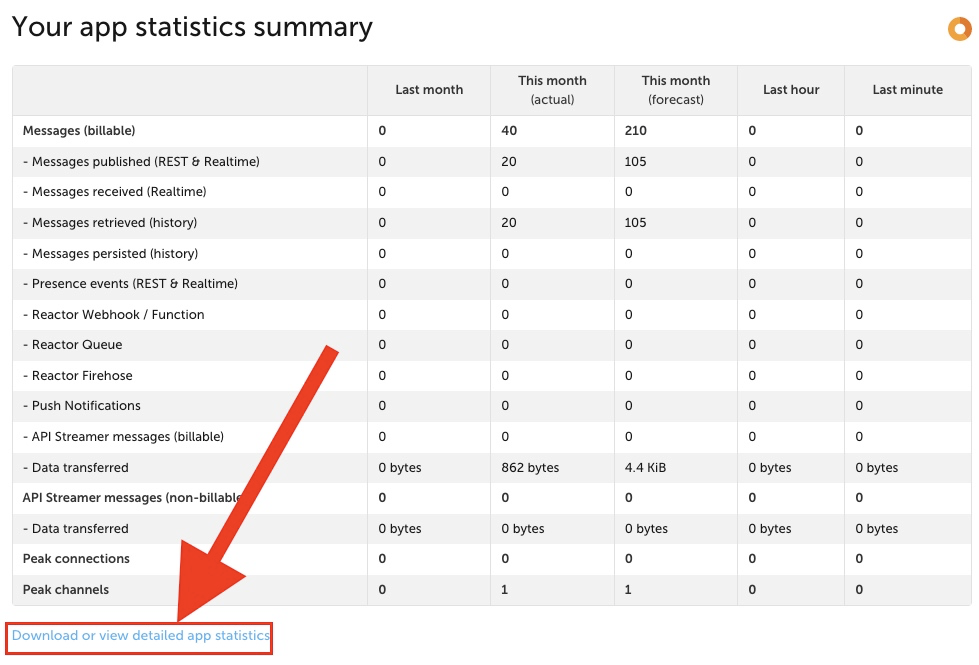
*Please note, the "This month (actual)" column shows your actual usage to date, and the "This month (forecast)" column shows what we believe may be your expected usage for the month based on your usage up to now, but is an estimation.
2. View your account stats by minute, hour, day or month, and choose to view all metrics or only the metrics that are active on your account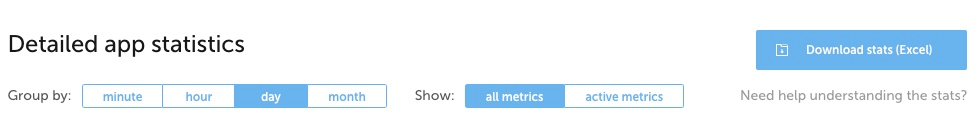
Reach out on our support portal if you have any further questions and we will be happy to help.
3. Accessing stats via the REST API
Here is an example curl command showing how to access stats for the current and previous minute using jq.
Here is a curl statement piped into jq which gives you the externalQueue stats. This counter records the Firehose stats. By specifying the second item in the JSON array we will get the last completed minute. The first item in the JSON array is the current minute, and therefore still increasing.
$ curl -u "api-key" \
https://rest.ably.io/stats?unit=minute\&limit=2 | jq '.[1].outbound.externalQueue.all'
  % Total    % Received % Xferd  Average Speed   Time    Time     Time  Current
                                 Dload  Upload   Total   Spent    Left  Speed
100  2674  100  2674    0     0  16208      0 --:--:-- --:--:-- --:--:-- 16304
{
  "count": 55,
  "data": 715,
  "uncompressedData": 715
}
If you want to see the current minute, specify element 0 in the JSON array as shown here:
curl -u "api-key" \
https://rest.ably.io/stats?unit=minute\&limit=2 | jq '.[0].outbound.externalQueue.all'
  % Total    % Received % Xferd  Average Speed   Time    Time     Time  Current
                                 Dload  Upload   Total   Spent    Left  Speed
100  2678  100  2678    0     0  24974      0 --:--:-- --:--:-- --:--:-- 25028
{
  "count": 42,
  "data": 546,
  "uncompressedData": 546
}
Here is an example showing a full document and some statistics. Depending on your Ably feature usage, you may get more elements.
If you are using Ably in that current second, then element 0 in the array will be the current minute, so for graphing purposes it should be excluded.
Using the curl command:
curl -u "api-key" https://rest.ably.io/stats?unit=minute\&limit=2
This JSON document is returned:
[
  {
    "all": {
      "all": {
        "count": 12,
        "data": 1450380,
        "uncompressedData": 1450380
      },
      "messages": {
        "count": 12,
        "data": 1450380,
        "uncompressedData": 1450380
      },
      "presence": {}
    },
    "inbound": {
      "realtime": {
        "all": {
          "count": 6,
          "data": 725190,
          "uncompressedData": 725190
        },
        "messages": {
          "count": 6,
          "data": 725190,
          "uncompressedData": 725190
        },
        "presence": {}
      },
      "all": {
        "all": {
          "count": 6,
          "data": 725190,
          "uncompressedData": 725190
        },
        "messages": {
          "count": 6,
          "data": 725190,
          "uncompressedData": 725190
        },
        "presence": {}
      }
    },
    "outbound": {
      "realtime": {
        "all": {
          "count": 6,
          "data": 725190,
          "uncompressedData": 725190
        },
        "messages": {
          "count": 6,
          "data": 725190,
          "uncompressedData": 725190
        },
        "presence": {}
      },
      "all": {
        "all": {
          "count": 6,
          "data": 725190,
          "uncompressedData": 725190
        },
        "messages": {
          "count": 6,
          "data": 725190,
          "uncompressedData": 725190
        },
        "presence": {}
      }
    },
    "connections": {
      "all": {
        "peak": 1,
        "min": 1,
        "mean": 0.3,
        "opened": 1
      },
      "tls": {
        "peak": 1,
        "min": 1,
        "mean": 0.3,
        "opened": 1
      }
    },
    "channels": {
      "peak": 1,
      "min": 1,
      "mean": 0.5,
      "opened": 1
    },
    "apiRequests": {
      "succeeded": 1
    },
    "processed": null,
    "intervalId": "2022-10-06:13:39",
    "unit": "minute"
  },
  {
    "apiRequests": {
      "succeeded": 1
    },
    "processed": null,
    "intervalId": "2022-10-06:13:24",
    "unit": "minute"
  }
]
Further reading